
2012 Energy and Mines Ministers Conference
DEFINING THE OPPORTUNITY: ASSESSING THE ECONOMIC IMPACT OF THE NATURAL RESOURCES SECTOR
Assessing the Economic Impact of the Energy and Mining Sectors in Canada
Prepared by Natural Resources Canada in collaboration with
Provincial and Territorial Governments
Energy and Mines Ministers' Conference
September 2012
Charlottetown, P.E.I.
EXECUTIVE SUMMARY
Canada's enormous natural resource endowment represents a critical component of our current and future economic prosperity. The natural resources sector represented 15% of Canada's nominal gross domestic product (GDP) in 2011 and close to 800 000 direct jobs, with an estimated equal number of indirect jobs linked to these sectors in the construction, manufacturing, transportation, financial, technology and service sectors. Governments also benefit from substantial revenues in the form of taxes and royalties associated with major developments.
Canada's energy and minerals and metals sectors are significant drivers of the economy. In 2011, they accounted for nearly 50% of Canada's merchandise exports and over $104 billion in capital investments. These sectors also contribute to more than half of carload traffic and more than half of the international cargo handled by Canadian ports.
In July 2011, Natural Resources Canada estimated that there would be over $500 billion in planned investment in more than 500 major projects in the next 10 years. As of August 2012, major resource projects currently under construction, together with projects planned over the next 10 years are estimated to represent approximately $650 billion in investment in over 600 major projects. The economic benefits of these major projects extend across Canada, including to Aboriginal, remote and northern communities.
The global demand for energy and mineral resources has grown over the past decade. This increase in demand, driven by fast-growing Asia-Pacific economies, is expected to continue over the long term. As the global economic picture for 2012 and the next few years remains uncertain and volatile because of the current economic crisis in Europe and the American fiscal situation, market diversification, particularly towards faster growing developing economies will become increasingly central to ensuring that Canada's natural resource endowment is translated into lasting jobs and growth for Canadians. Canada has a significant opportunity to capture these new markets and grow market share, but we face stiff competition.
To assess the magnitude and dimensions of the economic benefits associated with this capital spending of about $650 billion in projects currently underway or planned over the next 10 years, an economic impact analysis was conducted by Informetrica Ltd. The study estimates that Canada's GDP will increase by a cumulative $1.4 trillion from 2011 to 2021 as the result of the increased investments, with employment impacts projected at 6.6 million jobs or an average of 600 000 jobs per year over the next ten years. While impacts of resource development will be felt locally, they will also generate significant benefits in other regions through supply chain effects.
To fully realize Canada's tremendous resource potential and planned investments, governments must continue to collaborate and put in place the most effective measures to enable investment and responsible resource development. This includes a positive, open investment environment, efficient and effective regulatory systems, a strong innovation system, a well-functioning labour market, diversified markets supported by adequate infrastructure, and a commitment to environmental responsibility. Progress in these areas is addressed in Canada as a Global Energy Leader: Toward Greater Pan-Canadian Collaboration – A Progress Report.
Introduction
This report documents the current and forecasted economic benefits of the energy and mining sectors in Canada. It brings together an overview of global demand and supply and articulates how the natural resource sectors contribute to Canada's economy across all regions. The future economic outlook includes both the planned investments and a forecast of the economic impacts of these investments. This economic picture defines the unique opportunity that Canada has to transform its natural resource endowment into jobs, growth and long-term prosperity.
Global context: Demand and supply
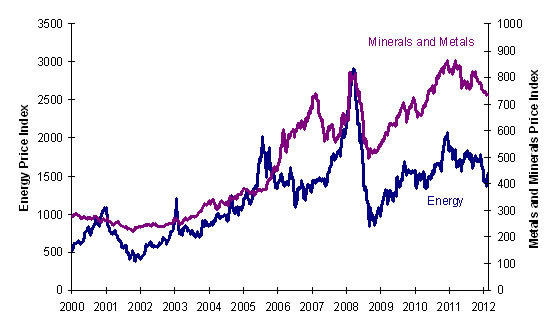
Over the last decade, there has been extraordinary growth in global demand for energy and mineral commodities, much of it tied to the emergence of fast-growing markets in the Asia-Pacific region. This caused a significant increase in commodity prices and has created favourable conditions for energy and minerals and metals development projects across Canada and globally (see Figure 1).
However, the prospects for global economic growth have weakened this year. In its July 2012 Monetary Policy Report, the Bank of Canada indicated that new developments in the euro area point to a renewed contraction, with nearly half of the euro area countries already in recession (see Figure 2 for projections). Although the U.S. economy is still expected to continue to expand at a modest pace, the Bank of Canada has revised its growth projection downward for the U.S. economy. In China and other emerging economies, the deceleration in economic growth has been greater than expected. Real GDP growth in China is projected to average 7.8% through to 2014.
This slowdown in commodity-intensive growth in emerging economies has a major impact on commodity prices. Although elevated by historical standards, commodity prices have declined in recent months. For example, the Bank of Canada's energy price index has fallen by close to 11% while the metals and minerals index has declined by about 6% between January and July 2012. This slowdown is also reflected in the Baltic Dry Index (BDI)1, which is based on the price for seaborne shipping of bulk raw materials (e.g. iron ore, fertilizers, grains). In late July, the BDI was 57% below its peak of October 2011.
Figure 1. Key commodity price indices
Source: Bank of Canada
[text version - Figure 1]
Figure 2. Projection for global economic growth

Source: Bank of Canada, July 2012 Monetary Policy Report
[text version - Figure 2]
Future outlook
Markets are expected to be characterized by two speeds in the medium and long term – modest growth in developed economies (2 to 3% annually) versus fast growth (8 to 10%) in emerging economies, including China and India. Looking through short-term turbulences, the Bank of Canada expects commodity prices to remain elevated over the medium term, owing to growth in emerging economies.
Markets are operating in a “two speed” world where there is modest growth in developed countries and fast-growth in emerging economies.
For example, the Chinese economy expanded at an average annual rate of 10.6% over the last decade and is expected to become the world's largest economy by 2030.2 By 2025, China's urban population is projected to grow to almost 1 billion. This trend toward increased urbanization will be resource-intensive, requiring 40 billion square metres of new residential and commercial floor space, translating into almost 5 million new urban buildings, including 30 000 skyscrapers3.
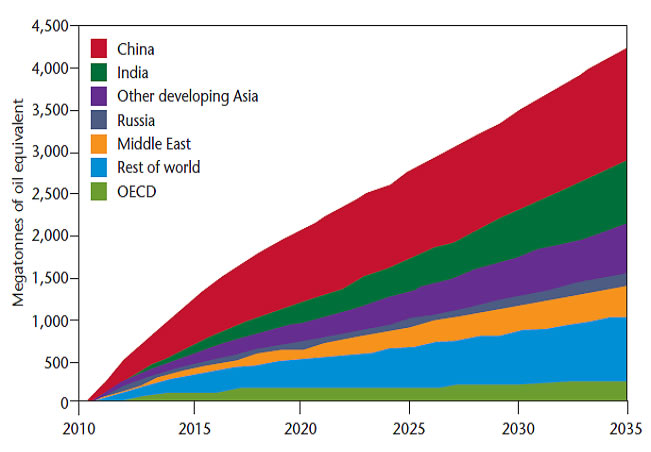
This “two-speed” world is manifest in forecasts for energy demand, where the growth is found in China, India and other emerging economies (see Figure 3). According to the International Energy Agency, China has already surpassed the United States to become the world's largest energy consumer. India is set to become the third largest energy consumer by 2030.
Similarly, global demand for minerals and metals continues to be driven by strong growth in emerging markets. For example, China's share of global demand for base metals alone has increased from 15% to 40% over the last decade (e.g., China's share of global demand for copper was 37% in 2010, and its share of global steel demand was 45% in 2010). Global supply, however, is increasingly constrained as development projects become more complex, costly and are in more remote or challenging environments. The cost base of the industry evolves, as low-cost sources of supply are exhausted, input costs rise (e.g. labour, steel and equipment, water and energy), and greater attention is paid to environmental and social conditions for development. Cost structures are also affected by technology that can improve economic and environmental performance of resource sector development.
Canada’s position in the world
Sources: United States Geological Survey, International Energy Agency, Alberta Energy Resources Conservation Board, Canadian Association of Petroleum Producers, Oil and Gas Journal. |
Figure 3. Projection of growth in world energy demand, by region, 2010–2035
Source: International Energy Agency, World Energy Outlook, 2011
[text version - Figure 3]
__________________________
1 Haver Analytics, Baltic Exchange
2 International Monetary Fund, World Economic Outlook Database, April 2012.
3 McKinsey&Company, Preparing for China's Urban Billion, March 2009.
Canada's natural resource endowment
Canada is the sixth-largest producer of oil and has the world's third-largest reserves of oil4. In natural gas, Canada is the world's third-largest producer, with technically recoverable reserves equivalent to more than 100 years of current production levels5. Canada's oil and gas reserves, including reserves of non-conventional resources such as oil sands and shale gas, put it among leading producers and exporters globally.
Given this global context, Canada is fortunate to have one of the largest and most diverse natural resource endowments in the world.
This rich endowment of fossil fuels places Canada in an enviable position, given that the International Energy Agency has indicated that fossil fuels will continue to be the dominant sources of energy for the foreseeable future. Projections show that fossil fuels will still account for well over 75% of the world's energy needs in the next 25 years, with projections showing demand for oil 18% higher in 25 years than it is today6.
Canada is the world's third-largest producer of hydroelectricity, and it has its own nuclear power technology. Correspondingly, more than three-quarters of our electricity comes from non-emitting sources. We have access to abundant renewable energy sources, including large and small hydro, biomass, wind, geothermal, ocean, tidal and solar. In short, Canada's energy potential is vast and diverse.
Canada is the world's top potash producer. It is the second producer of uranium – a key strategic resource for countries such as China and India that are building nuclear plants to meet their demand for electricity (see Figure 4). Canada was also the third-largest world producer of primary aluminum in 2011, with production of about 3 million tonnes. Additionally, Canada ranks as one of the top five world producers (by volume) of other key minerals and metals, including nickel and diamonds (11% and 9% of global production, respectively).
Figure 4. Canada's Minerals and Metals World Production Ranking by Volume, 2011
| Global Rank | |
|---|---|
| Potash | 1st |
| Uranium | 2nd |
| Cobalt | 2nd |
| Aluminum | 3rd |
| Nickel | 4th |
| Diamond | 4th |
| Zinc | 5th |
| Gold | 7th |
| Iron Ore | 9th |
| Copper | 9th |
| Silver | 11th |
Source: United States Geological Survey
Figure 5. Contribution of the natural resources sector to the Canadian economy, 2011
| Forest | Energy | Minerals and metals* | Total Natural Resources | |
|---|---|---|---|---|
| Nominal GDP (percent of the economy) | 1% | 10% | 4% | 15% |
| Employment | 188 791 | 286 825** | 320 280 | 795 896** |
| Domestic exports ($ billions) |
26.3 | 109.6 | 97.6 | 233.4 |
| New capital investment ($ billions) | 2.1 | 86.9 | 17.3 | 106.3 |
* Coal and uranium mining are included in the minerals and metals sector as per the North American Industry Classification System used by Statistics Canada.
** Pipeline sub-sector is included at an estimated 5000 jobs.
Note: Totals may not add due to rounding
Source: Natural Resources Canada calculations based on Statistics Canada data
Figure 6. Contribution of the energy and minerals and metals sector to the provincial/ territorial economies, 2011
| Nominal GDP | Jobs | |
|---|---|---|
| Newfoundland and Labrador | 43.7% | 7.0% |
| Prince Edward Island | 2.1% | 2.4% |
| Nova Scotia | 5.4% | 2.6% |
| New Brunswick | 9.2% | 4.5% |
| Quebec | 8.8% | 3.6% |
| Ontario | 5.8% | 3.3% |
| Manitoba | 11.7% | 4.3% |
| Saskatchewan | 35.1% | 8.1% |
| Alberta | 32.6% | 10.3% |
| British Columbia | 10.0% | 3.0% |
| Yukon | 18.4% | 5.6% |
| Northwest Territories | 40.4% | 8.8% |
| Nunavut | 23.5% | 3.1% |
Source: Natural Resources Canada calculations based on Statistics Canada data (GDP); Statistics Canada (jobs)
__________________________
4 This is important because 80% of the world's proven oil reserves are not open to market-based development. Of the remaining 20%, Canada has about 60%, the vast majority in Canada's oil sands.
5Canadian Society for Unconventional Resources
6 International Energy Agency, World Energy Outlook, 2011 (New Policy Scenario)
Contributions to Canada's economy across all regions
Canada has excelled in transforming its vast endowment into world-leading resource industries. Today, Canada's energy and mining sectors are significant components of the national, provincial and territorial economies, contributing to high living standards for Canadians7.
In 2011, the natural resources sector accounted for about 15% of Canada's nominal GDP8 (see Figure 5). Overall, these sectors continued to contribute significantly to provincial and territorial economies in 2011 (see Figure 6). The energy and minerals and metals sectors accounted for a large proportion of nominal GDP in Newfoundland and Labrador (44%), the Northwest Territories (40%), Saskatchewan (35%) and Alberta (33%).
Employment
The natural resources sector directly employs close to 800 000 Canadians, across the country. In 2011, the energy and minerals and metals sectors accounted for a large proportion of total employment in Alberta (10.3%), Saskatchewan (8.1%) and Newfoundland and Labrador (7.0%).
Through the purchase of goods and services, the energy and minerals and metals sectors drive in part the GDP of other sectors (e.g. construction, machinery, professional services). Using Statistics Canada's input-output model9, the indirect contribution of the natural resources sector is estimated at approximately $70 billion or 4% of nominal GDP and about 800 000 jobs in other sectors of the economy (see Figure 7). The number of indirect jobs is significant because supplier sectors, such as the construction industry, are much more labour intensive than the natural resource sectors.
Figure 7. Indirect effect of the natural resources sector on other sectors of the Canadian economy
| Sector | GDP (billions $) | Employment |
| 2011 | 2011 | |
| Construction | 32.1 | 329 693 |
| Manufacturing | 4.8 | 50 495 |
| Others | 33.5 | 449 879 |
| Total | 70.3 | 830 067 |
Note: Totals may not add due to rounding
Source: Natural Resources Canada calculations based on Statistics Canada data.
Export market
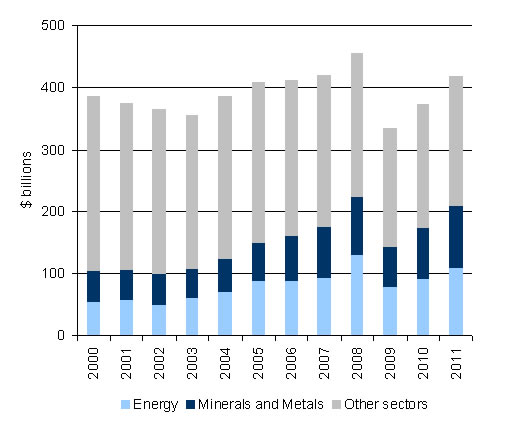
Energy and mineral and metal products also play a key role in trade, representing nearly 50% of Canada's total merchandise exports in 2011. Since 2000, rising commodity prices have coincided with increases in Canadian exports of energy and mineral and metal products. For instance, between 2000 and 2011, energy and minerals and metals exports increased by 102%, while energy prices grew by 130%, and minerals and metals prices more than doubled (see Figure 8). According to Statistics Canada, the growth of the natural resource sector over the past decades has had a positive and significant contribution towards Canada's terms of trade10, driving growth in real income and purchasing power. This improvement in Canada's terms of trade has translated into higher wages, corporate profits and lower prices for many consumer goods and investments.
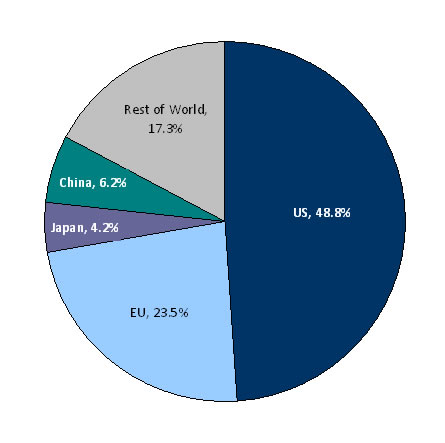
The United States remains the destination for most of Canada's energy exports (90% in 2011)11, while in the minerals and metals sectors, export markets are more diversified. In addition to the United States, the United Kingdom, China and Japan were key destinations for Canadian exports of mineral and metal products in 2011 (Figure 9).
Figure 8. Domestic exports ($ billions)
Source: Natural Resources Canada calculations base on Statistics Canada data
[text version - Figure 8]
Figure 9. Canadian minerals and metal exports by destination, 2011
Source: Natural Resources Canada calculations based on Statistics Canada data
[text version - Figure 9]
Growing value of Canada's natural resources
The value of Canada's natural resource endowment continues to grow. According to Statistics Canada, in 2011, the value of economically recoverable reserves of energy and mineral resources stood at $1,247 billion or $36,000 per capita, representing 15% of Canada's non-financial wealth12. On average, Canada's energy and mineral wealth (i.e. the value of energy and mineral resource assets) grew 8.0% and 13.7% per year, respectively, from 2000 to 2011 (see Figure 10). These estimates are based on a methodology that assumes current production levels are fixed over time.
Figure 10. Average annual growth, value of Canada's natural resource assets and produced assets (2000 to 2011)
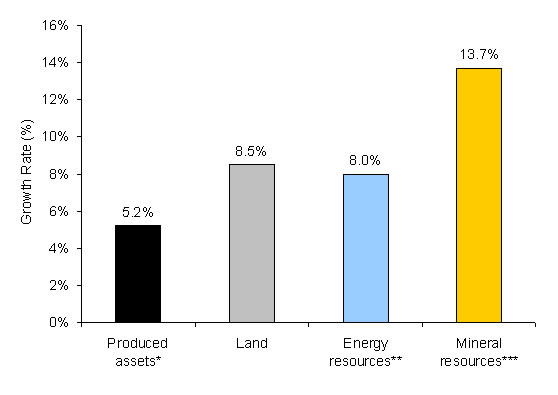
* Represents the value of produced wealth across Canada, including structures, machinery & equipment, consumer durables and inventories.
** Includes economically recoverable reserves of crude oil, natural gas, crude bitumen and coal (i.e. the portion of Canada's total stock that is known to exist with a high degree of certainty and that can be profitably extracted today).
*** Includes economically recoverable reserves of gold, iron, copper, nickel, lead, zinc, molybdenum, uranium, diamonds and potash.
Source: Statistics Canada, Natural Resource Accounts
[text version - Figure 10]
The value of Canada's resource wealth would be significantly larger if all of Canada's in-ground resource potential was considered. For example, Statistics Canada's value of energy reserves recognizes established conventional oil reserves (4 billion barrels) and established oil sands reserves “under active development” (26 billion barrels) for a total of only 30 billion barrels of oil. This measure is small compared to a reserve estimate of 173 billion barrels in 2011. This larger estimate includes remaining established reserves of 169 billion barrels in the oil sands in 2011 as estimated by the Alberta Energy Resources Conservation Board.
Investment in Canada's energy and minerals and metals sectors
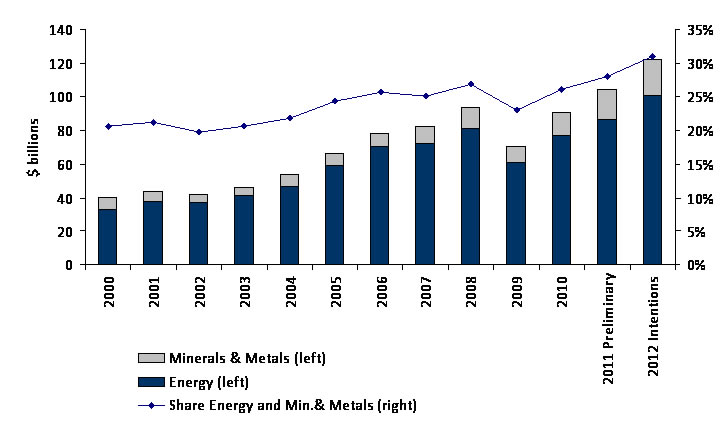
Capital investment in the energy ($87 billion) and minerals and metals ($17 billion) sectors reached over $104 billion in 2011, accounting for over 28% of investment in structures and machinery and equipment. Such spending includes constructing and procuring capital assets as well as capitalized costs, such as engineering fees13.
|
Energy investment Most investment occurring in the natural resource sectors went to energy in 2011 ($86.9 billion or 82%). From a subsector perspective, oil and gas extraction and supporting activities are a predominant part of the capital investment in the energy sector ($61 billion). While conventional oil and gas extraction still attracts the largest share, non-conventional oil extraction, mainly oil sands, is playing an increasingly important role. It now accounts for 39% of investment in oil and gas extraction, while its share was around 20% in 2000. Electricity power generation transmission and distribution, with $18.5 billion in investment in 2011, represented most of the remaining spending in the energy sector. Source: Statistics Canada calculations by Natural Resources Canada |
Of the $104 billion in capital investment, $61 billion occurred in the oil and gas extraction and support activities sectors, with the largest share in Alberta (70%). Other investments were in British Columbia (13%), Saskatchewan (8%) and Newfoundland and Labrador (3%). In addition, $25.5 billion worth of investment was allocated to other energy sub-sectors, primarily electricity (68%) (e.g. hydroelectric and other renewable energy projects)14.
The minerals and metals industry accounted for $17 billion worth of capital investment in 2011, with Saskatchewan, Ontario, Quebec and British Columbia receiving the largest shares. Together, these provinces accounted for 78% of mining investment. Relative to the size of their economies, the territories received a significant share of investment. Together, they accounted for 10% of total mining investment in Canada in 201115.
According to Statistics Canada, year after year, the natural resource sectors are key drivers of total investment in Canada. Our natural resource sectors intend on spending $122 billion on new capital investments in 2012 alone – including both major projects and ongoing investment. This represents nearly one third of the $394 billion in investment intentions in the economy.
Figure 11. Capital expenditures in the energy and minerals and metals sectors (left) and share of total investments (right)
Source: Natural Resources Canada calculations based on Statistics Canada data.
[text version - Figure 11]
|
Mining investments One third of the mining investments ($5.5 billion) occurred in the precious metals sector, mostly in Ontario (47%), Quebec (20%) and British Columbia (15%). The non-metal minerals sector was the second most important sector, with investment of $3.0 billion, mainly driven by the potash industry in Saskatchewan (85%). The base metals sector accounted for $2.5 billion, nearly a third of which occurred in British Columbia. Several commodities exhibit patterns of regional concentration. For example, 75% of the investments in the diamond sector went to the Northwest Territories, and Saskatchewan accounted for 90% of investment in the uranium sector. Similarly, Quebec and Newfoundland and Labrador together accounted for 89% of investment in the iron ore sector. Source: Natural Resources Canada |
Foreign direct investment in Canada's energy and minerals and metals sectors
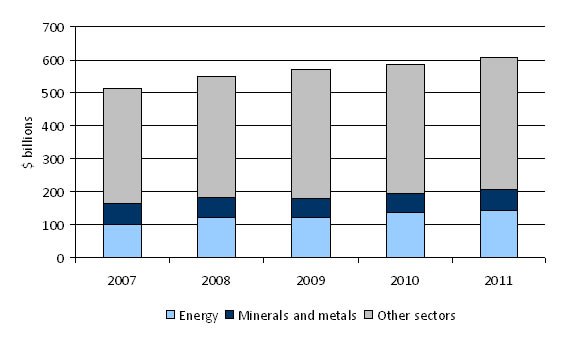
With such substantial resource development on the horizon, foreign direct investment (FDI) in the energy and minerals and metals sectors, which already accounts for over one third of FDI stock in Canada, has an important role to play in helping Canadians realize the full potential of their natural resources wealth (see Figure 12). Canada's attractive business environment will continue to be an important factor in realizing the investment required to develop, add value and transport energy, mineral and metal resources to domestic and foreign markets.
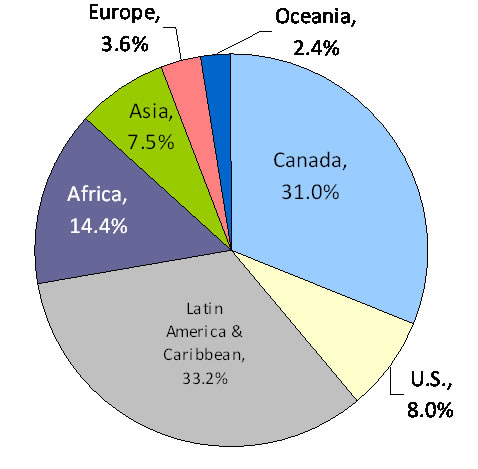
Canadian energy and mining companies also have a strong investment presence globally and own substantial assets abroad. For instance, Canadian exploration, mining and allied industries operated in 100 countries in 2010, with cumulative assets worth $129 billion outside Canada (see Figure 13). Additionally, the energy and minerals and metals sectors accounted for over one fifth of all Canadian Direct Investment Abroad.
Figure 12: Stock of FDI in the Energy and Minerals and Metals Sectors, 2007-11
Source: Natural Resources Canada calculations based on Statistics Canada data.
[text version - Figure 12]
Figure 13: Canadian Mining Assets by Region, 2010
Source: Natural Resources Canada
[text version - Figure 13]
Energy and minerals and metals sectors' contribution to rail freight traffic
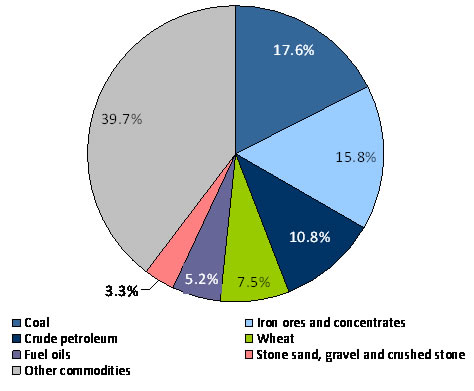
Canada's natural resources sector is a huge customer for Canada's rail companies. In 2010, energy and minerals and metals products accounted for 116.4 megatonnes or 50.4% of carload traffic in Canada. More specifically, coal, iron ore and concentrates, and potash accounted for 15.4%, 9.0% and 6.6% of carload traffic, respectively.
Regionally, energy and minerals and metals products accounted for 89% of rail traffic originating in the Atlantic region in 2010, with iron ore and concentrates alone accounting for 75%. Minerals and metals products also accounted for a large share of rail traffic originating in other regions (see Figure 14). Coal accounted for a large proportion of carload traffic (by volume) originating in British Columbia (50%) and to a lesser extent Alberta (16%). Potash accounted for over one third of rail traffic (by volume) originating in Saskatchewan.
In contrast, energy products (e.g. crude and refined petroleum products) accounted for a relatively larger share of carload traffic (by volume) originating in Quebec (19.5%), and, to a lesser extent, Ontario (9.5%) in 2010.
Figure 14. Contribution of energy and minerals and metals products to rail carload traffic by region of origin, 2010
| Energy | Minerals and metals | Total | |
| Atlantic Region | 2.0% | 87.1% | 89.0% |
| Quebec | 19.5% | 22.1% | 41.7% |
| Ontario | 9.5% | 26.6% | 36.1% |
| Manitoba | 3.1% | 8.5% | 11.6% |
| Saskatchewan | 2.7% | 40.4% | 43.1% |
| Alberta | 9.5% | 37.2% | 46.7% |
| British Columbia | 1.4% | 55.4% | 56.8% |
| Canada | 6.2% | 44.2% | 50.4% |
Source: Natural Resources Canada calculations based on Statistics Canada data.
Figure 15: International Shipping by Major Commodities – Loaded, 2010
Source: Natural Resources Canada calculations based on Statistics Canada data.
[text version - Figure 15]
Energy and minerals and metals sectors contribution to port activity
Energy and minerals and metals products also represented a large share of port activity in Canada in 2010. Similar to rail traffic, metallurgical coal shipped mainly from Canada's busiest port (Port Metro Vancouver, British Columbia) and iron ores and concentrates shipped mainly from the St. Lawrence Region (i.e. the Port of Sept-Îles, Quebec) were major contributors to total international cargo handled by Canadian ports in 2010 (see Figure 15)16.Natural resource value chain
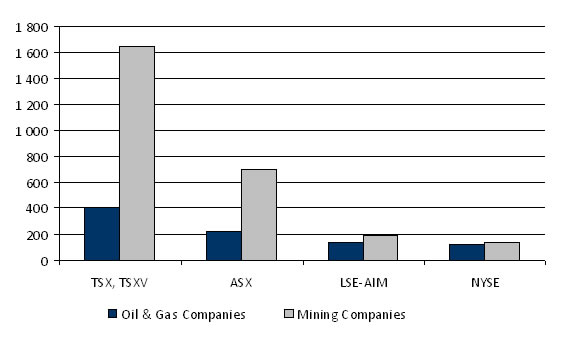
Canada's natural resource value chain extends into other parts of the economy, including world-leading financial services. As of December 31, 2011, 1646 mining companies and 488 oil and gas and energy services companies were listed on the Toronto Stock Exchange (TSX) and the TSX Venture Exchange, accounting for 56% of all issuers17.
The TSX and TSX Venture have more energy and mining companies listed than any other global exchange, representing 58% of the world's public mining companies and 35% of the world's public oil and gas companies.
Billions of dollars were raised on the TSX and TSX Venture in 2011 by oil and gas and energy services companies ($11.4 billion) and by mining companies ($12.5 billion). Over the past five years (2007–2011), the TSX and TSX Venture ranked first among the world's leading stock exchanges in terms of equity capital raised in the mining sector, accounting for 36% of the $220 billion raised globally in equity for mineral exploration and mining.
The bottom line is that Canada's resource value chain extends into other parts of the economy, including world-leading financial services, a growing clean technology sector, engineering and environmental services, and both upstream and downstream manufacturing. Also important are firms providing support services for mining and, particularly, oil and gas extraction. These companies are growing rapidly, supported by Canada's energy and mining sectors that are increasingly moving toward unconventional resources or developing supplies in deeper, remote and challenging locations18.
Figure 16. Oil and gas and mining companies listed on the TSX, the TSX Venture and other stock markets, as of December 2011
Source: TMX Group
[text version - Figure 16]
__________________________
7 For the purpose of this document, coal and uranium are included as part of the minerals and metals sector.
8 The chief difference between real and nominal GDP is how they account for price variations. Nominal GDP is based on current prices and, as a result, captures effects of both production volumes (quantity produced) and prices (rising or falling commodity/product prices). Real GDP uses 2002 market prices as a base and focuses on production volume. It is generally recognized that nominal GDP is a more accurate indicator of a sector's share of the economy because it captures the total income it generates.
9 Statistics Canada's Input-Output model provides detailed information on the structure of over 300 industries. The most recent year for which it is available is 2008. The model provides detail on the products and services used by these industries to produce their own outputs and from which industries these products and services are purchased. For example, natural resource development translates into increased activity in the construction industry. Using this methodology, as well as growth rates in GDP between 2008 and 2011, NRCan estimated employment and GDP occurring in other sectors of the economy as a result of activity in the natural resource industries.
10An increase in Canada's terms of trade allows Canada to purchase more imports for a given amount of exports.
11Natural Resources Canada calculations based on Statistics Canada data.
12 Economically recoverable reserves represent resources that can be recovered with current technology and under current economic conditions. Value estimates are calculated as the present value of the income stream generated from extracting the resources (i.e. equal to revenues minus extraction costs) over its estimated life. These estimates are based on a methodology that assumes current production levels are fixed over time.
13 Natural Resources Canada calculations based on Statistics Canada data.
14 Natural Resources Canada calculations based on Statistics Canada data.
15 Natural Resources Canada
16 Statistics Canada, Shipping in Canada 2010, March 2012.
17 TMX Group
18 “The unsung masters of the oil industry”, The Economist, July 21, 2012.
Future – 10-year outlook
This section of the paper examines the current and projected economic benefits of investments in Canada's energy and mining sectors. This economic picture defines the unique opportunity that Canada has to transform its natural resource endowment into jobs, growth and long-term prosperity.Capital investment plans – 10-year outlook
An inventory of investment in Canada's major natural resource projects was developed to better understand the magnitude of the economic impact. Projects are categorized by the province in which they are located, project status, monetary value and expected start and end date. The scope of the inventory is limited to major projects (i.e. more than $50 million for energy and minerals and metals projects). The list of anticipated projects and their estimated valueis based on a variety of sources, principally relying on project inventories from provincial and territorial governments, industry associations, private organizations, as well as information from media releases and company websites.
As of August 2012, more than 600 major projects in Canada's natural resource sectors were identified, representing about $650 billion worth of investment in projects underway or planned over approximately the next 10 years.
Major capital projects can have significant economic impacts on local economies, including in remote communities. The economic benefits extend across Canada through supply chain effects. Governments also benefit from substantial revenues in the form of taxes and royalties associated with major developments. The impact of investment is felt both at the construction stage and during operations.
Investments in major projects in the energy and minerals and metals sectors are at varying stages of development (see Figures 17 and 18):
- Underway investment ($152 billion) is defined as investment in projects currently under construction. These projects make up 23% of total planned investment. Alberta ($59 billion), Saskatchewan ($23 billion), Quebec ($17 billion), Newfoundland and Labrador ($17), and Ontario ($17 billion) represent a substantial proportion of underway investment. A majority of such investment (63%) is in the energy sector.
- Announced investment ($199 billion) is defined as investment in projects that have received federal and provincial approvals and secured financing, but have not begun construction. These projects make up 30% of total planned investment. Alberta ($90 billion) leads the way for announced projects, followed by Saskatchewan ($30 billion), and by Ontario ($27 billion).
- Proposed investment ($307 billion) is defined as investment in projects that are in their early stages; for example, projects undergoing environmental review, feasibility studies or in the process of securing financing. These projects make up 47% of total planned investment. The value of proposed projects is highest in Alberta ($86 billion), and British Columbia ($75 billion).
Investment in energy makes up the bulk of total planned investment, accounting for $464 billion or 71%. While investment in oil and gas development accounts for a large share of this amount, these investments also include major additions to the pipeline and electricity sectors, including significant renewable energy investment across the country. Investment in minerals and metals follows with $192 billion or 29% of total investment. Mining projects are underway or planned from coast to coast to coast and make a particularly significant contribution to Saskatchewan, Quebec, British Columbia, Newfoundland and Labrador and Nunavut. Regionally, Alberta ($235 billion) and British Columbia ($98 billion) account for 51% of all planned investment.
Figure 17. Planned investment in Canada by stage of investment, August 2012
| Stage | Value ($ billion)* | |||
|---|---|---|---|---|
| Energy | Minerals and Metals | Forest | Total | |
| Underway | 96.5 | 54.5 | 1.3 | 152.3 |
| Announced | 161.7 | 36.6 | 0.7 | 199.1 |
| Proposed | 206.2 | 100.4 | 0.1 | 306.6 |
| Total | 464.4 | 191.6 | 2.1 | 658.0 |
*Totals may not add up due to rounding
* Forest projects have a threshold of $5 million
Sources: Informetrica, Major Projects Management Office, Natural Resources Canada, Provincial Governments
Figure 18. Planned investment in Canada by province/territory, August 2012
| Jurisdiction | Value ($billion)* | |||
|---|---|---|---|---|
| Energy | Minerals and Metals | Forest | Total | |
| British Columbia | 67.3 | 30.7 | 0.3 | 98.4 |
| Alberta | 223.2 | 11.1 | 0.5 | 234.9 |
| Saskatchewan | 10.2 | 45.8 | 0.0 | 56.0 |
| Manitoba | 17.9 | 3.2 | 0.0 | 21.1 |
| Ontario | 63.9 | 16.9 | 0.5 | 81.3 |
| Quebec | 18.8 | 42.8 | 0.7 | 62.3 |
| New Brunswick | 4.5 | 6.4 | 0.0 | 10.9 |
| Nova Scotia | 3.3 | 0.5 | 0.0 | 3.8 |
| PEI | 0.9 | 0.0 | 0.0 | 0.9 |
| NFLD and Lab. | 26.1 | 12.7 | 0.0 | 38.7 |
| NWT | 16.9 | 4.3 | 0.0 | 21.2 |
| Yukon | 0.0 | 3.8 | 0.0 | 3.8 |
| Nunavut | 0.0 | 13.4 | 0.0 | 13.4 |
| Multi-region projects |
11.4 | 0.0 | 0.0 | 11.4 |
| Total * | 464.4 | 191.6 | 2.1 | 658.0 |
Potential economic impacts of planned capital investment
Ongoing investment in Canada's natural resource sectors presents an important opportunity to bolster production capacity and related economic benefits for workers and businesses in Canada. An analysis was undertaken by Informetrica Ltd. to examine the economic impacts of planned capital spending in Canada's energy and mineral and metals sectors over the next 10 years.
The injection of new investment into the economy will increase demand for goods and services from “upstream” firms – e.g., construction firms and manufacturers of machinery and equipment. Downstream, economic activity is generated from the business and revenue realized from an augmented capital stock and associated increases in production capacity and output in the energy and minerals and metals sectors. Combined, these impacts lead to new purchases of goods and services throughout the economy and additional income for workers, business owners and governments.
The study measured the impact of the $650 billion in planned capital investment on the Canadian economy19. The base case used for this study is the macroeconomic forecast prepared by Informetrica which underlies the reference case from the National Energy Board's (NEB) Canada's Energy Future (November 2011) publication.
The Informetrica analysis of economic impacts addresses direct impacts and consequent increases in economic activity. These impacts can be decomposed into three components:
- Direct impacts are the immediate effects of the planned capital spending. They include i) increased demand for goods and services in the construction, and machinery and equipment manufacturing sectors and ii) increased production in the energy and minerals and metals sectors (i.e. resulting from increased output capacity).
- Indirect impacts comprise incremental expenditures on goods and services in the economy caused by the direct impacts.
- Induced impacts include incremental changes in the economy that are caused by spending new income (e.g. wages, corporate earnings) generated by the direct and indirect impacts.
It is important to emphasize that this analysis is not limited solely to economic impacts stemming from incremental purchases of goods and services to build new capital assets. The Informetrica analysis also addresses impacts on economic output resulting from increased production capacity20.
Figure 19 presents results from the study at the sector and economy-wide levels in terms of cumulative GDP and employment impacts. In GDP terms, the Canadian economy is estimated to benefit from a cumulative $1.4 trillion from 2011 to 2021 as the result of the assumed increase in capital spending. Employment impacts, on the other hand, are projected at about 6.6 million jobs, or an average of 600 000 jobs per year over the next ten years.
The construction sector is a key beneficiary of the planned resource sector investment, with cumulative GDP increasing over base case levels by $207 billion during the next decade. Cumulative employment impacts in the construction sector amount to 1.76 million jobs, or an average of 160 000 jobs per year over the same period.
Other sectors seeing increased economic activity as a result of the capital spending include suppliers of goods and services, including financial services, professional services and wholesale and retail trade. Benefits associated with investments in the energy and minerals and metals sector, including the creation of long-lived, high paying jobs, will have lasting effects on Canada's economy.
Figure 19. Cumulative full GDP and employment impacts
| Industry | Cumulative GDP (billions $nominal) |
Cumulative Employment (thousand) |
|---|---|---|
| Energy | $332.3 | 434.7 |
| Oil and Gas Extraction | $271.1 | 225.0 |
| Electricity | $47.8 | 177.1 |
| Petroleum Refining | $1.8 | 16.4 |
| Pipelines | $11.6 | 14.4 |
| Minerals and Metals | $68.1 | 238.6 |
| Mining | $38.4 | 26.2 |
| Primary Metals Mft. | $4.3 | 48.1 |
| Non-metallic Mineral Prod. | $7.0 | 42.7 |
| Fabricated Metal Products | $18.5 | 121.6 |
| Construction | $206.9 | 1,760.0 |
| M&E Manufacturing | $36.1 | 193.8 |
| Retail and Wholesale Trade | $68.9 | 681.0 |
| Transportation and Storage* | $36.6 | 610.3 |
| Finance & Mgt | $114.3 | 171.0** |
| Prof., Sc. & Tech. Services | $89.3 | 582.3 |
| Other Goods and Services | $401.9 | 1,924.1 |
| Total Economy | $1,354.4 | 6,594.5 |
Note: Full impacts are the sum of direct, indirect and induced impacts.
*Excludes pipeline transportation
**NRCan estimate
Source: Informetrica.
__________________________
19 For this analysis, the planned capital investments (see pages 14-15) were modified to exclude capital expenditures initiated before 2011 and capital projects in the forest sector. The resulting planned investment totals $591 billion over the 2011 to 2021 period, of which 75% is in the energy sector. Based on historical data, two thirds of the investment is spent on non-residential structures, with the balance of expenditure concentrated on machinery and equipment.
20 Informetrica used its model and other sources (e.g. Statistics Canada data on sector capital/output ratios) to estimate increases in production in the energy and minerals and metals sectors that coincide with planned sector investments and the resulting expansion of sector capital stock. In all instances, sector increases in production are modelled through assumed increases in commodity exports.
Conclusion: Realizing the opportunity
Canada's energy and mining sectors are significant drivers of the national, provincial and territorial economies, contributing to high living standards for Canadians. In 2011, the natural resources sector accounted for 15% of Canada's nominal GDP, over 800 000 in direct jobs and close to 56% of Canada's merchandise exports. An equal number of Canadians were employed through related sectors such as industry construction, technology and financial services. The natural resources sector also represents the most significant investor in new capital in Canada. As of August 2012, there are planned investments of $650 billion in over 600 major resource projects currently underway or planned in the next 10 years. While these impacts will be felt locally, they will also generate significant benefits in other regions through supply chain effects. Analysis shows that these new, planned investments could increase Canada's nominal GDP by a cumulative $1.4 trillion, with employment impacts projected at about 6.6 million jobs or an average of 600 000 jobs per year over the next ten years.
As the global economic picture remains uncertain, diversification of export markets to capture long-term opportunities in the fast-growing Asia-Pacific region will be central to ensure that Canada's natural resource endowment is translated into lasting jobs and growth. Canada has a significant opportunity to capture these new markets and grow market share, but we face stiff competition.
To realize its full resource potential, Canada must create the right conditions for responsible resource development. Prosperity will increasingly depend on addressing a range of challenges, including: accessing new export markets, accessing and developing new resources, managing environmental risks, sustaining and growing a strong and competitive investment environment, and ensuring an adequate supply of skilled labour. Key steps have been taken to realize Canada's natural resource opportunity, including the Government of Canada's Responsible Resource Development plan. Canada is well-positioned as a global leader in energy and mining. Through concerted action by governments and industry, the opportunity for Canadians today and in future generations to benefit from our resource wealth is huge.Examples of energy and minerals and metals-related economic impact analysis
|
Evaluation of the economic impacts of the Gahcho Kué diamond project De Beers Inc. and Mountain Province Diamond Inc. plan to complete construction of the mine by 2017, at an expected cost of $549 million,1 with an additional $36 million going toward sustaining capital and closure expenses. The economic benefits of construction activity alone are estimated to include more that $500 million in GDP and over 4000 person-years of employment Canada wide. Operations of the facility are planned to run for an 11-year period starting in 2017. Including direct, indirect and induced effects, Canada-wide impacts are estimated to include over $4.2 billion in GDP and close to 1300 jobs annually over the operating period. Source: Prepared for the Government of the Northwest Territories by Schlenker Consulting Ltd. (1) All dollars amounts are expressed in terms of 2010$CDN. |
|
Lower Churchill Project: Muskrat Falls According to Nalcor Energy, construction of the Muskrat Falls Project is estimated to employ 2700 people at peak construction, with thousands more indirect jobs over the project's life. Other economic benefits include income to labour and business totalling $1.43 billion, more than $200 million in taxes to the provincial government, and 115 direct full-time jobs during project operations (i.e. from 2017 onward, for at least 50 years). The construction and operation of Phase II of the project – Gull Island – would support additional economic benefits. The development of Muskrat Falls would see renewable energy's share of total electricity supply in Newfoundland and Labrador reach 98%, and would provide rate stability and potential export opportunities. Source: The Economy 2012, www.economics.gov.nl.ca |
|
The Plan Nord Involving a range of sectors, including transportation, tourism, telecommunications, resource-based industries, etc., the Plan Nord extends over a 25-year period and is expected to lead to more than $80 billion in investment, including $28 billion in the mining sector and $47 billion in energy projects. The initiative is also expected to create or consolidate 500 000 person- years of employment and generate government tax revenues of $14 billion. Source: Gouvernement du Québec |
|
Pacific Access: Part 1 – Linking Oil Sands Supply to New and Existing Markets (Canadian Energy Research Institute, July 2012) The CERI study assessed potential economic benefits from both existing and new oil sands development over the next 25 years. Four scenarios were developed, each with different assumptions regarding pipeline infrastructure. In overview, the study concludes that infrastructure plays a key role in enabling economic benefits from oil sands development. CERI, 2012Case 4 – Existing pipelines, Keystone XL, Trans Mountain Expansion and Northern Gateway Economic Benefits, 2011-2035
|
|
Catching the Brass Ring: Oil Market Diversification Potential for Canada (University of Calgary, December 2011) The study examined the impact of eliminating the oil price differential with global markets. For example, the near-term benefits for increased access to Gulf Coast markets represent nearly US$10 per barrel for Canadian producers. The keys to realizing the economic benefits of eliminating the oil price gap are
Economic Benefits, 2016-2030
*Canada-wide |
|
Liquefied Natural Gas (LNG): A Strategy for British Columbia's Newest Industry If the five big LNG export plants are built, the impact on BC's GDP is expected to add $1.5 trillion by 2046 and require 100,000 persons/year of employment in construction and about 2,700 full time jobs once in operation. These five proposals translate into an estimated capital investment of $278 billion over the period 2013 to 2020 in LNG plants and marine terminals, pipelines and upstream natural gas development. In addition to generating significant corporate and income taxes and other value add taxes for the province, the projects are expected to deliver substantial benefits to First Nations and communities throughout BC, contributing an estimated $3 billion in incremental royalties by 2025 due to natural gas production volumes only. Source: Government of British Columbia (http://www.bcjobsplan.ca/natural-gas/) |
|
Ontario's Ring of Fire In May 2012, Cliffs Natural Resources, one of the major players in the area, announced its intention to invest $3.3 billion in Northern Ontario's Ring of Fire which includes an open pit/underground chromite ore mine (30-year mine life) and an ore concentrating facility in Ontario's Far North, a $1.8-billion chromite ferrochrome processing facility in the Greater Sudbury area and an integrated transportation system that includes a north-south-axis all-season road. The proposed project is expected to create as many as 1,200 direct jobs and additional employment opportunities at supplier industries for area First Nations and other Northern communities. The Ring of Fire is also an exciting opportunity to work in partnership with First Nations in the north, to realize new opportunites and support their goals. Projects proposed by Cliffs Natural Resources, as well as Noront Resources Inc. – which is proposing to develop a high-grade nickel-copper-precious metals deposit in the area – are currently undergoing coordinated environmental assessments at the federal and provincial levels. Source: Government of Ontario |
Bibliography
- AECOM Canada Ltd., Potential Employment and Income Impacts in Ontario from the Wolfe Island Shoals Project, December 2010.
- British Petroleum, Energy Outlook 2030, January 2012.
- Canadian Energy Research Institute, Economic Impacts of New Oil Sands Projects in Alberta (2010–2035), May 2011.
- Gouvernement du Québec, Plan Nord: Building Northern Quebec Together – The Project of a Generation, 2011.
- Government of Newfoundland and Labrador, The Economy 2012, April 2012.
- International Monetary Fund, World Economic Outlook, April 2012.
- National Energy Board, Canada's Energy Future: Energy Supply and Demand Projections to 2035, November 2011.
- OECD, OECD Economic Outlook, May 2012.
- Schlenker Consulting Ltd. (Prepared for the Ministry of Industry, Tourism and Investment, Government of the Northwest Territories), Evaluation of the Economic Impacts of the Gahcho Kué Diamond Project, September 2011.